
Market Monitoring Dashboards: The One-Stop Data Shop
If a spike in global wheat prices concerns you, you’d probably like to know its effect on your program budget 6 months from now. You can do that by simultaneously tracking global and local markets. But that takes time. Or did.
Market monitoring — tracking and analyzing indicators like price and availability of essential goods to determine local market health and project costs — is a critical step in designing and managing effective programming. Tracking market conditions over the life of a program can identify the direct and indirect impacts of changes and point to strategies to mitigate resulting shocks.
The added ability to confidently forecast prices help determine how much funding is needed for program activities, such as food assistance, in the future.
There’s a catch.
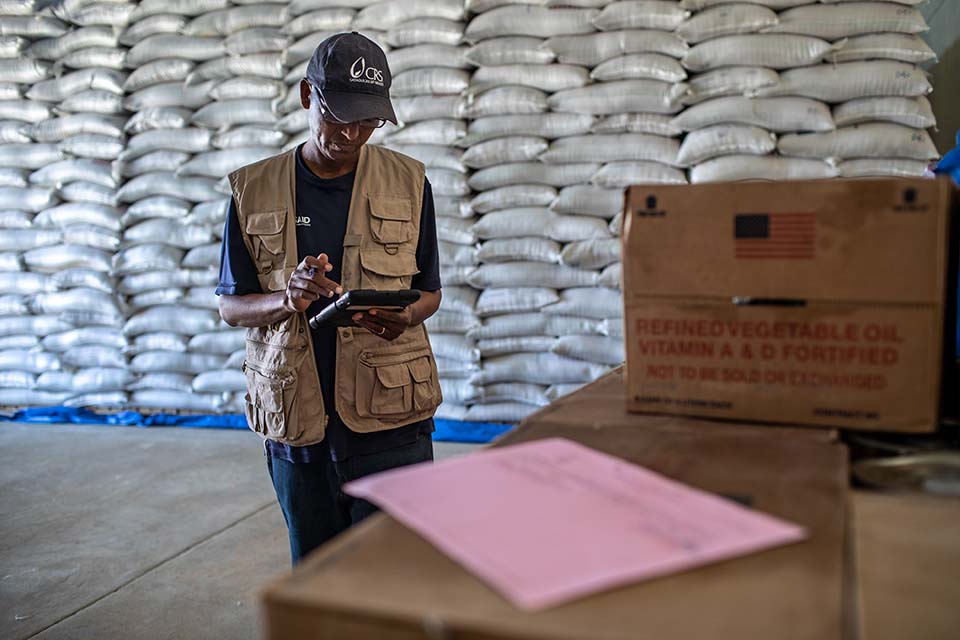
A CRS field officer uses a tablet while looking over commodities stored at a warehouse for a large-scale food distribution.
Photo by Will Baxter/CRS
Monitoring market prices at a high-confidence level requires immense amounts of data collected from a wide range of sources. Historically, the process has been manual and time-consuming. It meant spreadsheets and slide presentations.
“You want a one stop shop for a lot of these data,” says Sonja Perakis, market monitoring and analysis senior advisor for CRS under the global supply chain management team.
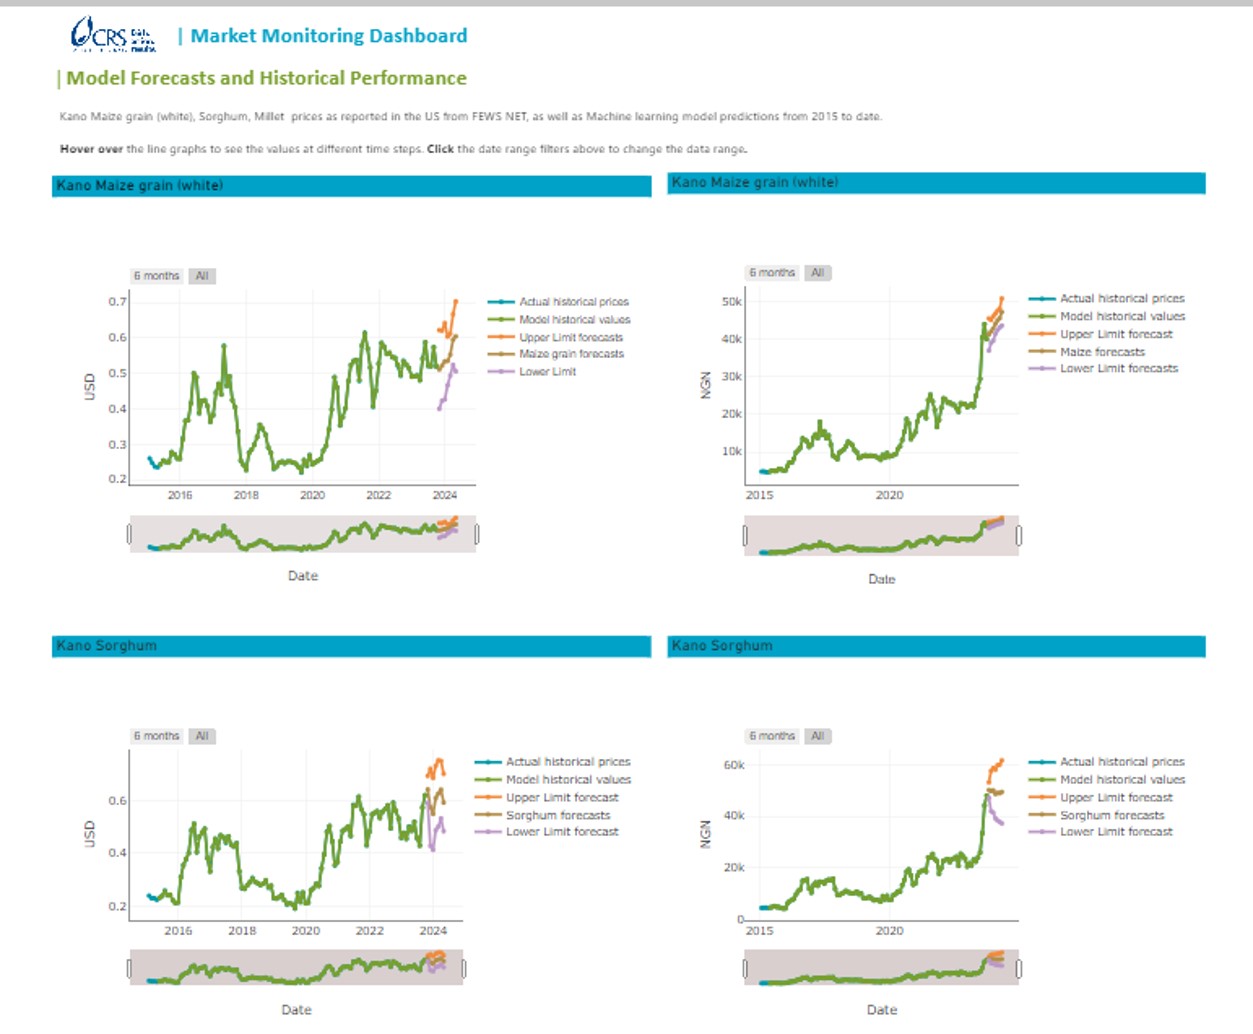
That shop is CRS’ Market Monitoring Dashboard.
"Now, if you want to know the current exchange rate and how it's varied since the last year and then how inflation relates to it — that's all in one place and anybody can go to it.”
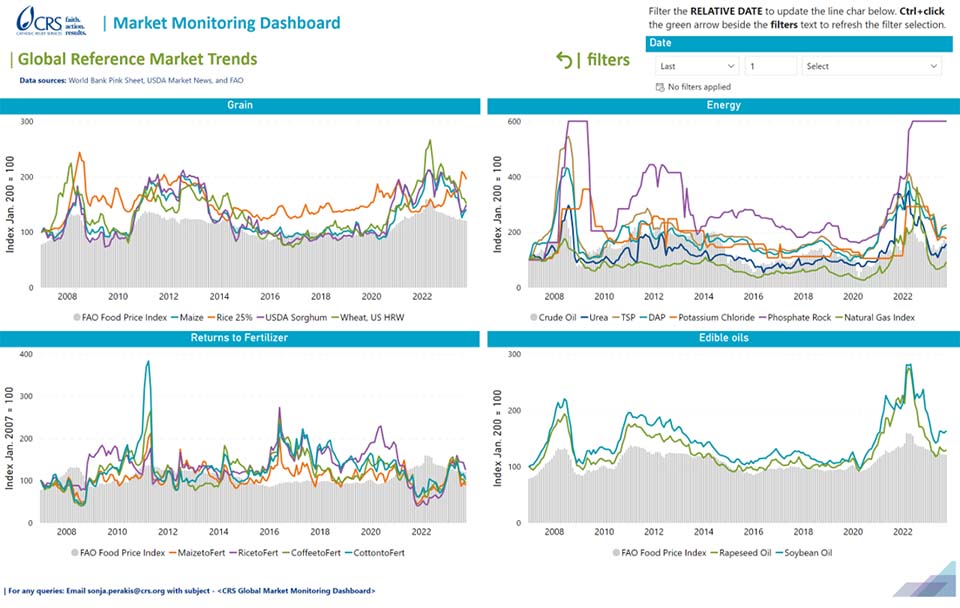
Catholic Relief Services Market Monitoring Dashboards enable rapid collection and interpretation of large quantities of market data for food and other essential items.
Using PowerBI as the data visualization tool, the dashboard draws price information from sources such as Trading Economics, the World Bank, FEWS NET, the World Food Programme, USAID and others. Those numbers are combined with data collected locally by CRS Country Programmes when available for specific countries or circumstances.
The dashboards allow price forecasting 6 to 12 months out with a high level of confidence.
Emphasis on data fidelity
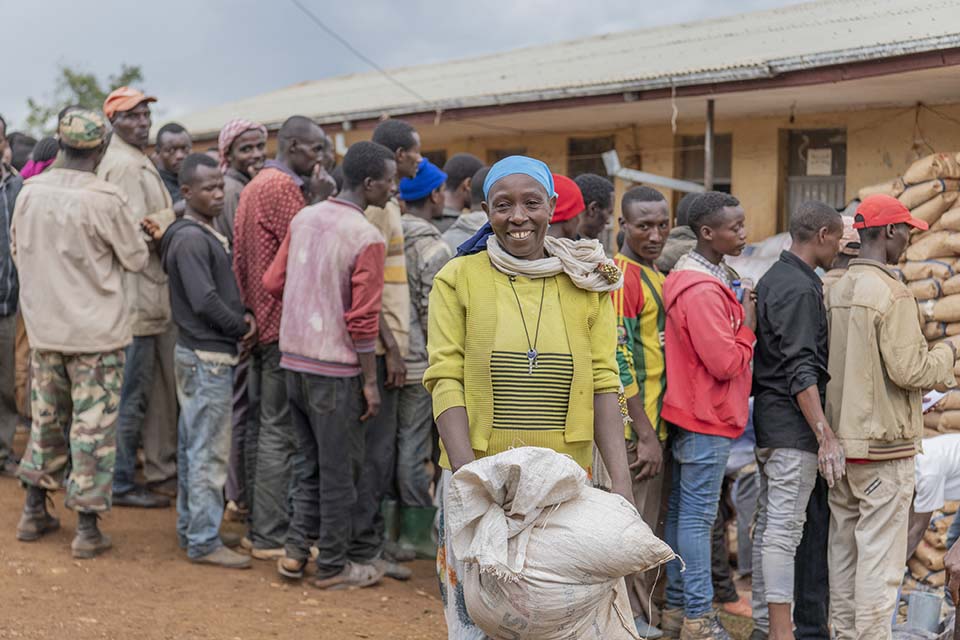
Program participants receive food aid including commodities such as oil, corn soy blend and split yellow peas.
Photo by Maheder Tadese for CRS
Primary source data is still drawn from the only place it can be — individual country programs. Some data are publicly available, the agency pays for others.
“We pull from a range of different commodities,” Perakis says. “We look at the key sources of food and fuel for the countries that we operate in and then also imports and exports. For example, the global dashboard tracks things like gold, silver, aluminum, cocoa … When we see a dip in cocoa prices from the Ivory Coast, that's not a good thing.”
It’s important to be able to track those things in the countries that rely on those commodities as a large part of their export earnings.
“The global dashboard tracks lots of different commodities. Specific country program dashboards, though, are very much curated and tailored to that individual country context,” Perakis says. “If they want to know the cost of gold, they could go to the global dashboard and look at that. But they don't need to know it every day.”
Not all global food shocks are going to have local implications. Even the magnitude of the shock might differ based on whether a country's dollarized or has a local currency.
Dashboards collect macro-level data — the global numbers that may or may not affect various countries or affect them in very different ways — and location-specific information.
The dashboard can also eliminate confusion over apparently contradictory information. For example one country claims wheat prices are rising, another says they’ve dropped. A data point from a very specific, reliable source shows both countries are correct in their context.
“The same thing with the exchange rate,” Perakis says. “It's pretty easy to get confused and kind of flipped upside down when looking at exchange rate data and some other economic data. Now, if you want to know the current exchange rate and how it's varied since the last year and then how inflation relates to it — that's all in one place and anybody can go to it.”
Collecting data
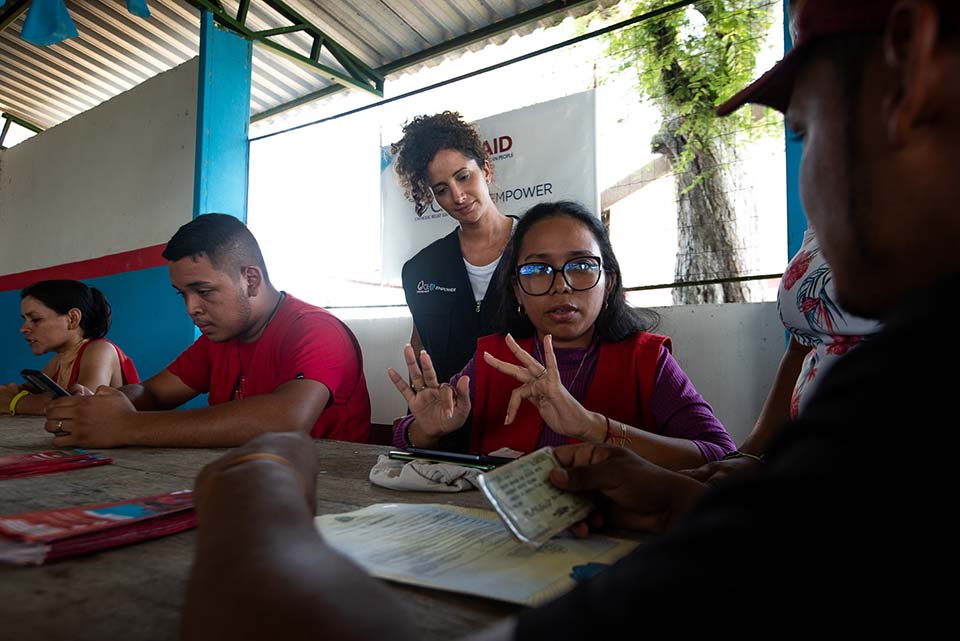
A CRS technical advisor works with volunteers to collect data from from nearby villages as part of a drought response.
Photo by Felippe Thomaz for CRS
Prior to developing the dashboard system, CRS’ market monitoring team was offering the same results through a manual process. A team would download Excel files and communicate findings with PowerPoint presentations. It took time to compare each source and make the necessary connections. The ICT4D team hoped to make the process easier and faster.
Information Communications Technology for Development — ICT4D — brings tech solutions to improve the quality, impact and scale of humanitarian and development programming. In this case, the goal was to consolidate and present pricing data.
“Initially we set up the dashboards by using publicly available data, coming from reliable, global sources,” said Janeen Kim Cayetano Data Analyst providing technical assistance to the project. “We call that a global dashboard. All the information is set up there. Then we go to the country level. We add local data, which is collected by the country programs.”
The API links allow for a smooth automated updating system. At first, both CRS market monitoring and ICT4D teams made adjustments till the data sets were reading correctly. They also needed to make sure the data sources and the country program data were in the same standard measure.
"When it comes to price points, you have the World Bank price per ton of let's say rice,” Cayetano said. “And then in the country program, it's per kilo. We needed to make sure that those adjustments are made to allow for comparability.”
The dashboard takes advantage of existing APIs to connect to its information sources, such as Trading Economics, the World Bank, FEWS NET, COMTRADE, WFP, USAID, USDA, FAO, and national food security and market information services such as FSNAU in Somalia. Cayetano said about 80% of dashboard data is obtained from sources like these.
The other 20% are collected locally for specific countries or situations.
High confidence level
Employing machine learning , dashboard users can forecast prices looking out as much as six months to a year. Returns routinely come in at a 90% or higher confidence level at 6 months out. In the not too distant past, confidence levels of 70% stirred excitement.
Kathryn Clifton, data analytics lead at CRS attributes the high-confidence threshold to the machine learning that’s now part of the dashboard process. Teams are able to run a variety of statistical models. Now, she says, she’s tempted to question results that fall below the 90% confidence mark.
While the Market Monitoring Dashboard can be applied to hundreds of problems, forecasting for food prices is more accessible because more historical data is available. An advantage when confronting the extreme urgency of, for instance, the global food crisis.
“For that, what we need to know is, are we able to buy enough food,” Clifton said. “It's that simple. So we use math to help figure that out.
“What we're trying to do is take that historic volatility and forecast into the future to say, ‘this is what we expect prices will be.”
Justified by data
Commodity price fluctuations are tracked closely given the need to ensure that what beneficiaries receive remains adequate over time. The dashboard allows tracking at any given point in time in specific country contexts.
In the case of cash and voucher assistance (CVA), once a market monitoring dashboard is set up, country programs can compare their current transfer values with the cost of the intended basket of goods that households are buying. It allows an evidence base to justify program adaptations and advocacy work.
From a donor’s perspective, it’s reassuring when budgets set by projects are actually able to meet the intended purpose.
“When we're doing other types of market-based programming, tracking local and regional procurement our country programs can say, ‘here was our intended purchase price when we developed our procurement plan last year. But here's how we need to adjust our program this coming year in the context of the new market conditions,’” Perakis says.
“Donors appreciate having a transparent evidence base to justify program adaptations we might be asking for.”
If you're looking across the models and you can see they’re all telling you the same thing — prices are going to peak in this month, for instance — that’s useful information. While the donor community may not be keen to allocate money based on forecasted values in all cases, they are typically willing to engage in conversations about contingency planning.
The CRS dashboard also looks at historical volatility in individual country programs. If, for instance, prices consistently varied at certain times in the course of the year, and that pattern holds for the past five years, the budget can be adjusted accordingly.
“And again,” Perakis says, “it's all justified based on the data.”


